|
|
Labsheet 4 - sample solutions and discussion
-
In Lecture-4 we saw how a number of uncoordinated nodes
can share a transmission medium,
such as a wireless medium,
by using the medium in a cooperative manner and
using randomness to resolve contention.
....
-
Convert your pseudo-code into some executable code,
written in Java, Python, or C
(your choice, you don't have to use the provided example code).
Your solution should complete your function SlottedAloha()
so that it will calculate the network's channel utilization for various parameters.
The approach is to execute a simulation for a large number of timeslots
determining, during each slot, what each node does.
Initially all nodes are idle - they do not have a frame to transmit.
Then, during each timeslot,
a node may remain idle,
it may probabilistically wish to transmit a frame for the first time, or
it may probabilistically wish to re-transmit a frame that couldn't previously be
transmitted.
If, during any timeslot,
no node wishes to transmit, then part of the available bandwidth is 'wasted'.
If exactly one node attempts to transmit a frame
(either a new or an old frame),
then that frame will be successfully transmitted (without collision).
Finally, if two or more nodes attempt to transmit in the same timeslot,
they will cause a collision,
bandwidth is again 'wasted',
and each node will attempt to retransmit in the future.
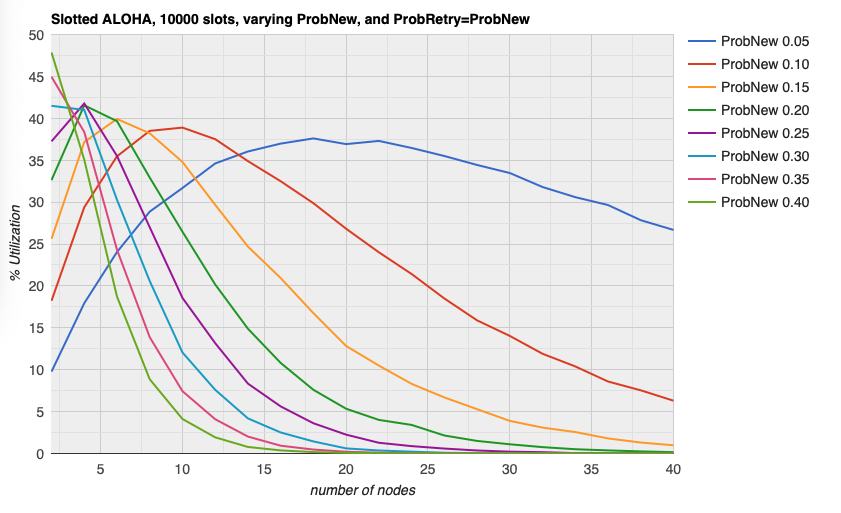
Note that is is possible for the utilization of a slotted-ALOHA network
to exceed 37%.
In fact,
if exactly one node wishes to transmit frames during every timeslot,
and no other nodes have anything to transmit,
then the utilization will be 100%.
[sample solution in C:
slottedaloha-soln.c]
-
In a manner similar to previous exercises using cnet,
develop a shellscript to execute your simulation many times,
varying the number of nodes,
and the transmission probabilities.
Using Google Charts (or any other preferred software)
to plot the channel utilization for the various parameters.
This sample shellscript is derived from one in Labsheet-2 comparing the
basic stop-and-wait protocol and a protocol employing negative-acknowledgments.
This solution does not use cnet,
but executes our slottedaloha-soln many times,
varying the probability that a node has a new-transmission (0.05...0.40)
and the number of nodes (2,4,6,...40).
Because we can only produce a 2D plot,
we set the probability of a re-transmission to be the same
as for a new transmission.
[sample solution:
plot-slottedaloha-to-html.sh]
Chris McDonald
March 2024.
|