
|
cnet v4.0.4 |
| home topology files command‑line options the core API FAQ download and install |
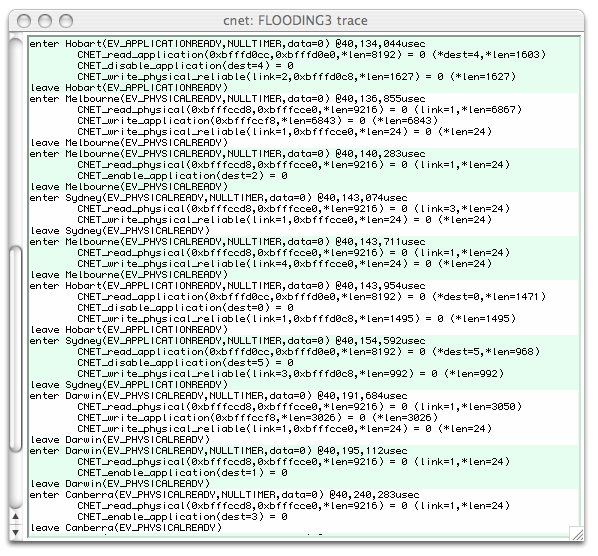
Tracing cnet's executionThe development and debugging of network protocols is a difficult task. Without the support of a development environment, the development of even a two-node protocol requires access to both nodes and, possibly, the physical communication medium. This is, of course, one of the primary reasons that we use network simulators, such as cnet. We have the ability to "peek" inside each network node, and even the communication links, to see what is happening and to, hopefully, expose errors in our protocols. Although cnet permits protocols to be written in C and executed natively in a single operating system process, it does not provide traditional debugging support. Moreover (unfortunately) because of the way cnet manipulates the single process's data segments to transparently schedule nodes, standard debuggers, such as gdb, can't "keep up" with what is happening and begin reporting incorrect information. cnet aids the development and debugging of network protocols with a minimum of intrusion. cnet enables the delivery and execution of events and cnet's own functions to be traced. Each event's commencement and termination, and each function's invocation, parameters, and return value annotated. The picture below shows a cnet simulation which was commenced with the -t option to enable tracing. 
The displayed first line of the trace, above, indicates that the
handler for the
The first of these (line 2) was
The return value of Note that due to cnet's event driven programming style, that events do not interrupt or preempt one another. The trace stream will always show what is being executed with only one level of indentation.
With reference to the this screenshot,
we can see that the next event for Melbourne, at The tracing of function parameters using only their hexadecimal addresses is error-prone and confusing. Moreover, different local variables in different event handlers will have the same hexadecimal addresses (as they'll be on the function's runtime stack), leading to more confusion. Additional cnet API calls may be added to the protocol's code, such as:
CNET_trace_name(&destaddr, "dest");
CNET_trace_name(lastmsg, "newmessage");
to request that the strings
By default, a copy of cnet's trace stream appears in the trace-window when cnet is invoked with the -t option. Alternatively, tracing may be toggled using the windowing interface, by selecting a checkbox to change the default or specific node's attributes. When executing without the GUI interface, the trace stream appears via cnet's standard error stream. The complete trace stream may also be mirrored to a named file by setting the tracefile global attribute.
From within the C code of a protocol it is possible to trace only certain
events, possibly for only certain nodes of interest.
For example, a call such as
if(nodeinfo.nodenumber == 1) {
int oldmask, newmask;
oldmask = CNET_get_trace();
newmask = oldmask | TE_PHYSICALREADY | TE_TIMER2;
CNET_set_trace(newmask);
......
CNET_set_trace(oldmask);
}
All required |