

Exercise sheet 4 - sample solutions and discussion
These exercises should be undertaken using bash and the Terminal window application (under macOS, Linux, or Windows WSL).In the lecture of Week-7 we introduced two new shell programming concepts - shell functions and hereis documents, that enabled us to transform simple CSV textual data into an HTML file suitable for viewing in a web-browser.
- [files required: cssubmit.html,
and
subtimes.csv]
Our Task, here, is to reproduce the cssubmit.html file (into a different HTML) using the new shell features of shell functions and hereis documents.
Our sample solution for this Task was developed in the recorded video of Week-7.
plotcssubmit.sh (which will probably download when you click on the link) employs a number of new (and common) techniques -- checking that the shellscript was given a command-line argument (a filename),
- hereis documents,
- expanding environment variables within a hereis document,
- defining and calling shell functions,
- passing the shellscript's command-line argument to a shell function, and
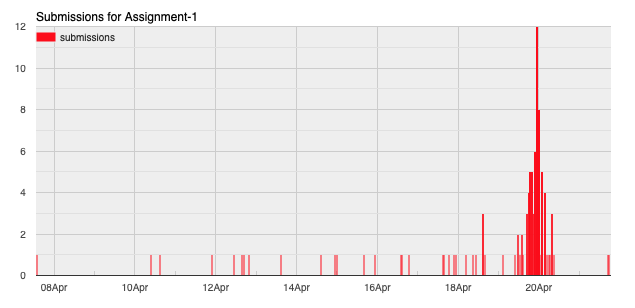
- an example of a Google Chart written as HTML output.
The result of displaying our HTML output in a web-browser:
- Fuel prices in Western Australia....
Historically, the maximum fuel price at most petrol stations has been seen on Tuesdays, it steadily drops until the following Monday, and then jumps up again the following day. Of course, wise customers anticipate this cycle, and try to purchase their fuel on Mondays.
....
Recently, it has been observed that the lowest price point is now on Tuesdays, not Mondays. Does the historical data support this observation?Our sample solution to solve this Task is very similar to that of Task #1. We develop a shellscript to accumulate all four months of data, and then extract the specific rows, and then fields, that we want. Depending on how general we wish our shellscript to be, we may perform these commands either at the beginning of the whole script, or within the shell function that converts and generates the data rows:
cat jan.csv feb.csv mar.csv apr.csv | grep 'Caltex StarMart Nedlands' > caltex.csv grep ,ULP, < caltex.csv | cut -d, -f1,5 > daily-prices.csvplotfuel1.sh (which will probably download when you click on the link) employs the following methods -
- a command pipeline to collate all required lines of FuelWatch data,
- a shell function to generate the 'top half' of our Google Line Chart (remember that Task #1 used a Column Chart),
- a shell function to extract dates and prices from each line of data,
and to reformat them into data rows for the chart.
Note that we need to determine our operating system type,
as the date command is different on Linux and macOS.
This is the core of this Task:
function generate_data() { # DETERMINE OUR OPERATING SYSTEM TYPE # BECAUSE date SUPPORTS DIFFERENT COMMAND-LINE OPTIONS ON LINUX AND MAC case `uname` in Linux*) OSTYPE=Linux ;; Darwin*) OSTYPE=Mac ;; *) echo "cannot determine your OS type" exit 1 ;; esac # EXTRACT THE FIELDS WE WANT FROM EACH LINE OF DATA grep ,ULP, < $1 | cut -d, -f1,5 > daily-prices.csv # USE bash TO READ EACH LINE OF THE DATA, PLACING FIELDS IN bash VARIABLES while IFS=, read date price ; do # USE date TO CONVERT EACH DATE TO ITS DAY-OF-YEAR # 01/01/2020 -> 1 # 02/01/2020 -> 2 # .... # 30/04/2020 -> 121 if [ $OSTYPE == "Linux" ]; then D=`echo $date | cut -d/ -f1` M=`echo $date | cut -d/ -f2` Y=`echo $date | cut -d/ -f3` DOY=`date -d "$M/$D/$Y" "+%-j"` else DOY=`date -j -f "%d/%m/%Y" "$date" "+%-j"` fi # GENERATE A DATA ROW FOR THIS DAY+PRICE echo " [ $DOY, $price ]," done < daily-prices.csv # REMOVE THE TEMPORARY FILE WE CREATED rm -f daily-prices.csv }
- a shell function to generate the 'bottom half' of our Google Line Chart, and
- simple commands to call each of our 3 functions.
The result of displaying our HTML output in a web-browser is:
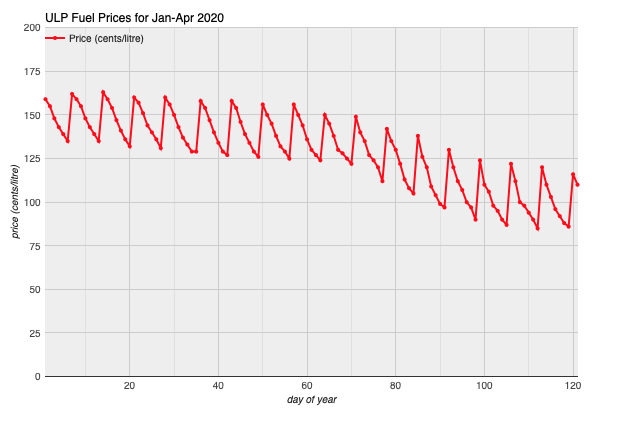
Our plot clearly shows that prices have dropped this year, and that they appear to fluctuate regularly, but what about the observation that the lowest price point has moved from Mondays to Tuesdays?
If viewing the plot in your browser, hover your mouse over each lowest price. You'll see the first is on day 6, the next on day 13, ... all 7 days apart. But we notice that the low prices on days and 34 and 35 were the same - the shift from Monday to Tuesday!
- 🌶
Revisit the use of a Line Chart
to now produce two lines on the same plot -
such as one for March, and one for April.
....
Does your Line Chart show that the lowest price, each week, has shifted from a Monday to a Tuesday?
Our sample solution to solve this Task is very similar to that of Task #2. From Task #2 we have observed that the day of the lowest price 'shifted' between days 34 and 35. So we need to plot the data for January and February on the same chart.
plotfuel2.sh (which will probably download when you click on the link) is very similar to fuelwatch1.sh, but the shell function to collate the data now needs to deal with two files, and merge their data into data rows suitable for a Google Line Chart with two plots on the chart:
function generate_data() { # EXTRACT THE FIELDS WE WANT FROM EACH MONTH'S DATA grep ,ULP, > $1 | cut -d, -f1,5 | cut -c1-2,11- > month1.csv grep ,ULP, > $2 | cut -d, -f1,5 | cut -c1-2,11- > month2.csv # JOIN THE DATA INTO ONE FILE, USING THE DAY-OF-THE-MONTH AS A COMMON KEY join -t, month1.csv month2.csv > twomonths.csv # USE bash TO READ EACH LINE OF THE DATA, PLACING FIELDS IN bash VARIABLES while IFS=, read day price1 price2 ; do # GENERATE A DATA ROW FOR THIS DAY+PRICE echo " [ $day, $price1, $price2 ]," done > twomonths.csv # REMOVE THE TEMPORARY FILES WE CREATED rm -f month1.csv month2.csv twomonths.csv }The result of displaying our HTML output in a web-browser is:
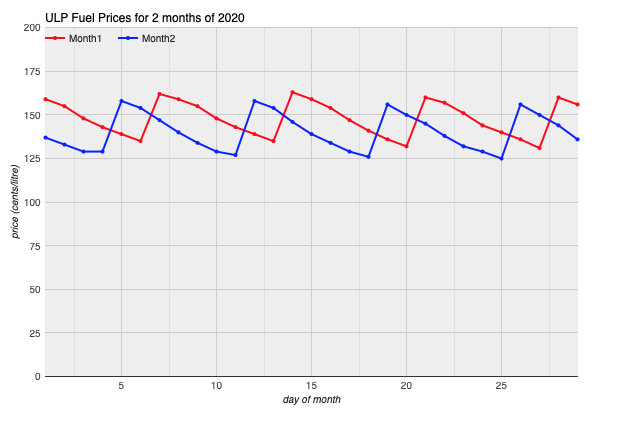
Our plot clearly shows that prices for both months have a regular cycle but, unless we have a calendar handy, just joining the data on the day of the month (1,2,3...) doesn't clearly show the shift from Monday to Tuesday.
Still to come - 🌶🌶 we need a better solution in which the X-axis is labelled with (repeating) days of the week, (Sun, Mon, Tue,....).
Chris McDonald
April 2020.
School of Computer Science and Software Engineering
University information
CRICOS Code: 00126G