
|

|
|
Demonstration of completed projects by students in Week 13 during the labs. Grouping Form groups of 2 or 3 students. No need to inform me of the group members now. TimelineMonday 9th April 2018: Project released. Week 7 to Week 13: Work on your project. A lab demonstrator will be available as usual to guide you during the lab hours. Wednesday 30 May 2018 (2:00 - 4:00PM): Project demonstrations of half of the groups. Thursday 31 May 2018 (2:00 - 4:00PM): Project demonstrations of the remaining half of the groups. Friday 01 June 2018 4:00PM: Deadline for submitting your project report and code on cssubmit. This is the last day of the teaching semester so no extensions are possible. THE PROJECT Automatic pedestrian detection in video frames (or images) is a significant problem and has applications in autonomous driving and city planning. You are required to develop a pedestrian detection system and a graphical user interface to demonstrate it. Your system should be able to detect any number of pedestrians in an image at any scale and draw a box around them with confidence of detection written on top of the box as shown in the image below. 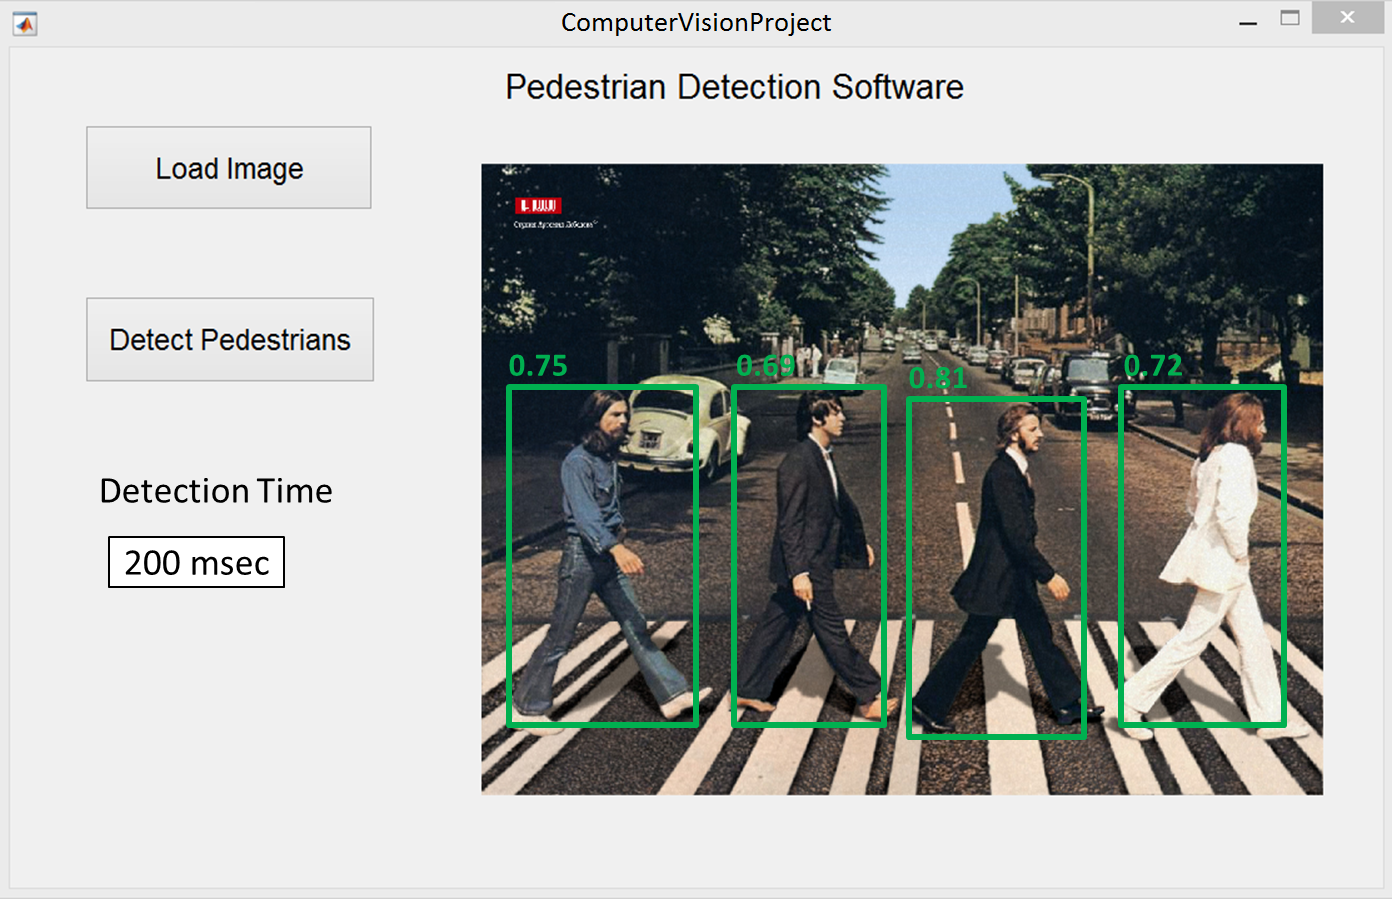 The above is only a sample image and your code should work for different backgrounds and different pedestrian poses. You are allowed to design a better looking GUI and with more functionality. There are two phases to develop such a system (1) the learning/training phase and (2) the detection phase. Learning Phase/ Training Phase 1. Use a labelled training dataset of pedestrians i.e. images where the bounding box of each pedestrian is provided. These bounding boxes are your positive samples. 2. Regions outside the bounding boxes are your negative samples. Extract different scale bouding boxes from the background such that they do not contain any pedestrian. It is OK if your negative bounding box has a small part of a pedestrian. 3. Extract features from each bounding box. Possible features are HOG, HAAR, LBP, Dense SIFT, CNN (very good) and others. It is up to you to chose the best feature type or even multiple features for your framework. 4. Optionally, consider to compress the features (especially if their dimensionality if very high) by projecting them into the PCA space. 5. Train a classifier or even multiple classifiers e.g. NN (Nearest Neighbour), SVM (Support Vector Machine), RDF (Random Decision Forest), Neural Networks, or any other classifier, to separate the positive and negative sample features. Training Data 1. You can chose any training data that you like. Here is a link to a simple dataset for pedestrian detection. 2. Use only part of the data for training and the rest for testing your system e.g. out of the 170 images use 130 for training and the rest for testing. Testing Phase 1. Load a test image (not included in the training phase). 2. Slide a window (bounding box) over the image at different scales and extract similar features (as above) from it. 4. Use the trained classifier to classify a window as positive or negative. 5. If a bounding box turns out to be positive, draw it over the image and display the confidence of detection on top of it. The classifier should give you this confidence measure. Develop a simple GUI for testing your algorithm as shown above. When the GUI starts, it should automatically load your trained classifier model. Note that the training phase occurs before/outside the GUI and on the demonstration day, you should already have trained your classifier. This means that you can use algorithms/classifiers that take a long time for training. You can even use multiple classifiers and combine their decisions. However, the testing should be fast; ideally 30 frames per second or 1/30 seconds per image. Note: You are allowed to use any library, toolbox, external code. However, you must demonstrate your code on the Lab 2.01 computers. Demonstrations on personal laptops and computers will not be accepted. Distribution of Marks (total 25 marks) GUI to test your code, the testing phase only: [2 marks] Feature(s) extraction. [6 marks] (learned features or two types of features will get you 6 marks) Classifier(s) training/ accuracy of detection. [10 marks] (marks according to detection rate) Calculation and display of confidence measures. [2 marks] (calc 1.5 mark and display 0.5 mark) Speed of detection. [5 marks] ( {5, 4, 3 ,2, 1} marks for < {1, 5, 15, 30, 60} seconds for 640x480 image) OPTIONAL CHALLENGE Design your system so that it works in real time on videos (pre-recorded or live from the webcam). TIPS Use this script to load/view the PennFudan dataset [link , download data and toolbox]. You can use the Matconvnet toolbox to extract CNN features [link] Use additional datasets to increase your training samples. FAQS How do I form a group?
How do I generate negative samples?
Should I keep the aspect ratio of the bounding box fixed for testing?
Can I add additional parameters/buttons to the test GUI? Demonstration Each group will demonstrate/present their code by performing pedestrian detection in images that I will provide on that day. Project Report and Code Submission Requirements Your project report should be approximately two A4 pages in PDF format. It should briefly explain the different components of your system and the choices you made e.g. selection of features and classifiers etc. Upload (on cssubmit) a folder containing your project report, your code, trained classifier model(s) and any additional code or libraries required for testing your code. Marks will be based on your demonstration, report and code. There is a limit of 1MB on cssubmit for the upload file size. If you have large files such as CNN models, include a link only in your code e.g. in Matlab see the urlwrite( ) command. |