Hormones are biochemical compounds produced by specialised tissues and then secreted into the biological fluid
(eg, blood in animals or sap in plants) response to specific stimuli.
The hormones are then transported to specific target tissues where they regulate key physiological and
behavioural processes.
The coding of this information is can be based simply on hormone concentration in biological fluid,
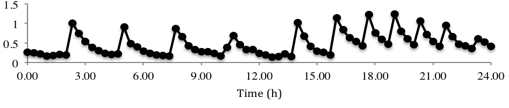
but can also include regular cycles over, say 24 h (daily rhythms), or the frequency and amplitude of
short, rapid increases in concentration, usually known as pulses (Figure 1).
Fig1. Profile of luteinising hormone (LH) showing the pulsatile pattern of secretion of a major hormone in the reproductive system of vertebrate animals.
The study of regulatory processes therefore often involves the analysis of both concentration and
variation in concentration over time.
The normal methods for measuring hormone concentration in biological substrates are radioimmunoassay (RIA),
enzyme-linked immunosorbent assay (ELISA) and enzyme immunoassay (EIA).
They are based on the fitting of a curve describing the relationship between concentration of a standards
and the level of a signal (radioactivity, colour, fluorescence) with a specific instrument. ELISA or
EIA methods are costly but rapid and sensitive, and are used for small numbers of samples (hundreds).
RIA method is very sensitive and low cost when used to assay large number of samples (over a thousand),
so is most appropriate for analysis of pulse patterns.
We need to develop an integrated software package for processing the raw data generated by the primary
instrument (eg, gamma counter) and for the analysis of pulsatile patterns of secretion (stochastic analysis).
Commercial software has been created to perform these analyses but most of it is either discontinued
or is only available for a single platform (often a combination of instrument and computer system supplied
by the instrument manufacturer).
None of the available software integrates both processing of raw data into assay output with
stochastic analysis (pulses), or statistical analysis of long-duration rhythms.
The software package will:
Run on multiple platforms (Windows, Macintosh, Unix)
Capture data from the various instruments that generate the raw data;
Analyse raw data using standard curves;
Analyse profiles to detect pulses, rhythms and trends, based on both the variability of the assay and the biological variability of the data;
Generate reports that illustrate the quality of the data processing and the characteristics of the pulses and long lasting change (amplitude, nadir, duration, frequency);
Include a database that can be used to refine the parameters used in the algorithms.
Client
Contact Person: Dominique Blache
Telephone: 6488 6763
Email: [email protected]
Preferred method of contact:email
Location: CSIRO Floreat and UWA Crawley